


Featured Stories
-

Enhance Surface Performance with Corona Treatment in Printing and Laminating Applications
Converters working with plastic films like polyethylene or polypropylene often face poor surface receptivity. -

The Rise of Flexible Packaging: Why Stand-Up and Flat-Bottom Pouches Are Replacing Rigid Containers
The packaging industry is undergoing a fundamental shift as brands increasingly move away from rigid containers in favor of stand-up and... -

News | New Products
-
Anderson & Vreeland Welcomes Kevin Sakai as Technical Sales Manager for Canada Operations
Anderson & Vreeland, ULC. ("A&V"), a prominent distributor and manufacturer in the flexographic industry
-
UV Ray Appoints New Distributors in the Americas, Australia and Portugal
UV Ray has expanded local representation of its UV LED, dichroic mirror, and hybrid curing systems with the appointment of AGS (Australian Graphic Servicing Pty. Ltd.)
-
Minova Labels Chooses Vetaphone for its Lombardi Presses
Established in 2006 by Ivan Caldirola and his business partner, Minova Labels began life with a Gidue 430 8-colour press and added a second Gidue 630 10-colour press in 2010.
-
PACK EXPO Las Vegas Celebrates 30 Years of Innovation
PACK EXPO Las Vegas, one of North America’s most comprehensive packaging and processing events is celebrating a milestone
-
APR’s Inaugural Recycling in Action Month Draws National Participation, Boosts Public Confidence in Plastics Recycling
Thousands of Americans got a firsthand look at how plastics are recycled during the Association of Plastic Recyclers’ (APR) inaugural Recycling in Action month
-
Flint Group NC-Free innovations honored at FIA UK Awards
Flint Group, a leading supplier of inks and coatings for the global print and packaging sectors, is proud to announce that its nitrocellulose-(NC) free ink innovations
-
FPA Testifies at U.S. House Subcommittee Hearing on Recycling and Economic Development
Felton Urges Federal Support for Investment in Recycling Infrastructure, Innovation, and National Labeling Standards to Help Achieve Full Circularity for Flexible Packaging and Films
Expert Advice


Static Beat | Assess Static Risks Using Electric Fields
- Published: May 13, 2019
Fieldmeters have been available for over 80 years dating back to at least 1936 when the General Electric Company patented an electrostatic field mill device having rotating vanes (US 2,032,932). The interest back then was measuring the electric fields near high voltage power lines. These very sensitivity field mills are commercially available (see, for example the JCI 140) along with the closely related vibrating sensor fieldmeters (see, for example the Monroe 257D). Newer and more economical electrometer / capacitive sensor fieldmeters are also available (see, for example handheld electrostatic fieldmeters). Even with our 80-year experience using electrostatic fieldmeters, assessing static risks remains challenging. To assess static risks, we must first understand what our readings mean.
First, I acknowledge and thank three of my colleagues for helping me understand fieldmeters, how to use their readings, and their insights that I offer here to you.
- Jeremy Smallwood, Electrostatic Solutions Ltd
- Bill Vosteen, President, Monroe Electronics
- Al Seaver, Electrostatics Consultant
Assess static risks by looking at the electric fields measured by our fieldmeters. The confusion is that many static meters display readings in volts rather than field. Electric field are measured in volts per distance. KV/in or KV/cm are common units. To assess static, convert your static readings into electric fields. To do this, use equation 1 and divide the static meter reading in KV by the measurement distance DMEAS.
 (Eq. 1)
For example, if your meter reads +5 KV at a measure distance DMEAS of 1 inch, the nominal electric field ENOMINAL is +5 KV/in.
Assess static risks using the Static Stop Light Levels in Table 1 once you know the electric field.
Table 1: Static “Stop Light” Levels
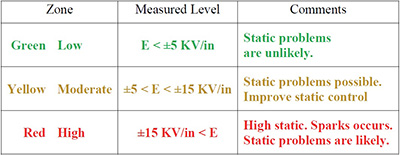
The industry standard “5,000 Volts rule” (see A. Seaver, “Analysis of electrostatic measurements on non-conducting webs,” Journal of Electrostatics, Vol. 35, 1995) defines the “Green Zone” where static levels are low and sparks are highly unlikely. My experience is that sparks are likely in the “Red Zone” where static is high. In between these two zones is the “Yellow Zone” where static is moderate and static control should be improved to get the readings into the “Green Zone.”
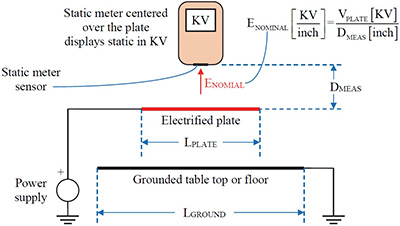
Figure 1: The static meter is calibrated to display the voltage of a conducting plate.
Let’s take a closer look at static readings. The static meter in Figure 1 detects the electric field at its sensor. For converting applications, the meter would be more useful if it displayed the nominal electric field in KV/in or KV/cm. However, many static meters are calibrated to display the voltage of the conducting plate. For example, when the power supply in Figure 1 is set for +5.0 KV, the static meter displays +5.0 KV when it is held at the recommended measurement distance DMEAS. Of course, the plate size LPLATE must be much larger than the measurement distance DMEAS so that the static sees only the plate and not the grounded surface below, which might be a table top or perhaps the floor.
When calibrating the meter in Figure 1, the nominal electric field detected by the meter in Eq. 1 varies as 1/DMEAS, which makes this measurement distance very important.
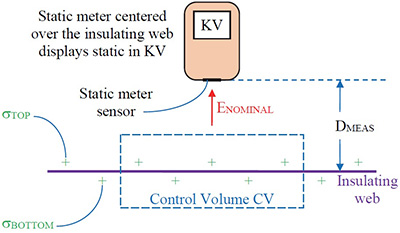
Figure 2: We use static meters to detect the static on insulating webs.
In converting operations, we use the static meter in Figure 2 to detect the static charges on the insulating web. Insulating webs are different from conducting plates. The nominal electric field ENOMINAL in Eq. 2 detected by our meter in Figure 2 is proportional to all of the electrical charges inside control volume CV.
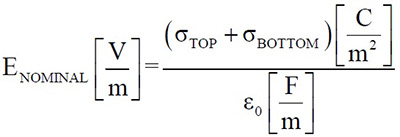
(Eq. 2)
The constant e0, the permittivity of free space, is 8.85×10⁻¹² F/m or 8.84 pF/m. So, if our web has a charge density of +2.0 mC/m2, (+2.0×10⁻⁶ C/m2), the electric field would be 2.3×10+5 V/m, which is 2.3 KV/cm or 5.7 KV/in. So, a charge density of +2 mC/m2 on our web is just enough static to move the fieldmeter reading out of the “Green Zone” and into the “Yellow Zone.”
The electric field near an insulating web is different from the field near an electrified plate in two important ways.
- The electric field near our insulating web is the same whether we measure from the top or from the bottom of the web. Both readings are proportional to the sum of the charges on both surfaces. So, we can pick either surface. Choose the one to measure that is easier and safer.
- The electric field near our insulating web is nearly constant and does not change strongly with the measurement distance DMEAS. So, if we hold the meter at a distance that is a little bit different from the recommended measurement distance DMEAS, our reading will still be accurate.
Assess static risks using electric field calculated by dividing the static reading by the measurement distance. For example, if your meter reads +5 KV at a measure distance DMEAS of 1-inch, the nominal electric field ENOMINAL is +5 KV/in. Then, use the “Static Stop Light Levels” in Table 1 to assess static risks.
Please feel free to contact me if you have any questions or if you would like additional information. My email address is: Kelly.Robinson@ElectrostaticAnswers.com.