State of the Industry Report
- Published: March 02, 2020
Compiled by Joan Mantini
PFFC worked closely with a number of associations to get their perspective on their specific segment of the industry. Below you will find a comprehensive overview including facts and statistics of various segments PFFC covers throughout the year. The report takes a look at the flexible packaging market with overview facts from the Flexible Packaging Association’s (FPA) “State of the U.S. FLEXIBLE PACKAGING Industry Report 2019,” as well as an update from Michael M. D’Angelo, president of the AICC, The Independent Packaging Association, who gave his insights on how the corrugated, folding carton, rigid boxes and other paper-based packaging market is thriving as the packaging industry faces the growing challenges of sustainability trends.
You can also find highlights below from the The 6th drupa Global Trends Report, which shows that the global print industry is in stable condition overall. And finally, in the 2020 State of the Industry Report, Dave Rousse, president of INDA, the Association of the Nonwoven Fabrics Industry in North America gives an update on the state of the U.S. nonwovens industry, stating that it is strong and growing.

Flexible Packaging on the Rise
With advances in plastics film technology, the flexible packaging market developed as a significant industry in the 1950s, nearly 70 years ago. Today, by combining the best qualities of paper, plastic film and aluminum foil, flexible packaging can deliver a broader range of protective properties, yet employs a minimum of material making it a desirable choice. According to the “State of the U.S. FLEXIBLE PACKAGING Industry Report 2019” released by the Flexible Packaging Association (FPA), flexible packaging’s versatility, efficiency and cost-effectiveness contribute to its continued growth.
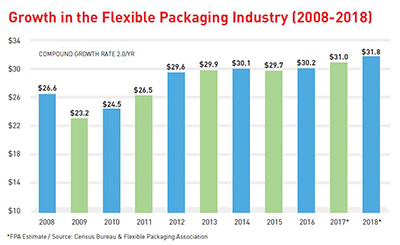
According to the report, the total flexible packaging industry is estimated to be approximately $31.8 billion in annual sales for 2018. This $31.8 billion includes packaging for retail and institutional food and non-food (including medical and pharmaceutical), industrial materials, shrink and stretch films, retail shopping bags, consumer storage bags, and wraps and trash bags.

The focus of the FPA’s report was on the segment of the industry that adds significant value to the flexible materials, usually by performing multiple processes, a segment that is estimated to be about $24.7 billion for 2018, without including retail shopping bags, consumer storage bags or trash bags.
Since its development during the industrial boom following World War II, flexible packaging has maintained steady growth. The FPA reports that since 1992, year on year growth has been positive in almost every year except 2001 (impact of post 9/11 terrorist attacks) and 2009 (the ‘Great Recession’), with an annual cumulative growth rate of about 2 percent per year. Over the last 10 years, flexible packaging’s share of total packaging (expressed as a percent of dollar value) has remained reasonably steady at 16 percent to 19 percent.

Today the U.S. flexible packaging industry employs nearly 79,000 people in the U.S. and encompasses a variety of manufacturing methods, materials and resources. The average flexible packaging converter is a small to medium-size company with annual sales totaling approximately $76-$78 million.
The top 100 flexible packaging companies (out of the estimated total of 408):
- Account for about 77 percent of total industry revenue with an average size of about $245 million; also
- Account for just over half (53 percent) of flexible packaging industry revenue and have average sales of about $1.6-$1.7 billion.
According to the “State of the U.S. FLEXIBLE PACKAGING Industry Report 2019,” flexible packaging represents approximately 19 percent of the total $170 billion U.S. packaging industry and is the second largest packaging segment behind corrugated paper and just ahead of bottles and miscellaneous rigid plastics packaging. Flexible packaging’s solid long-term strength coupled with flexibles’ ability to replace other packaging formats has resulted in the growth of flexible as a percent of total U.S. packaging, increasing from 17 percent in 2000 to the current level of 19 percent in 2018.
Paper-Based Packaging Thriving
“It’s popular these days look at the state of an industry on the basis of headwinds and tailwinds. In corrugated, folding carton, rigid boxes and other paper-based packaging media, the industry has been enjoying mostly tailwinds,” said Michael M. D’Angelo, president, AICC, The Independent Packaging Association. “This is primarily due to the unique position the industry holds in terms of the sustainability of its products. The paper and paper-based products’ recovery rate in North America is nearly 70 percent. A box-maker’s product is the most recycled item on the planet.”
According to the AICC, 80 percent of paper mills are utilizing recovered fibers to some degree. Any virgin fibers entering the stream come from an infinitely renewable resource – trees. These will certainly be recovered, several times over. Plus, North American forests are among the most sustainably managed in the world.
“These facts give the simple box a tremendous head start for the hearts and minds of the brand owner and the consumer,” said D’Angelo.
But is the box as simple as it seems? Box design and performance has become a high tech and high visibility aspect of marketing and brand presence, according to the AICC. Box production is the realm of high speed, high efficiency equipment. Paper-based packaging’s versatility, printability and protective characteristics allow the box to lead the way in eCommerce; in subscription-based products; in value-added goods; in brick and mortar retail and in interactive boxes and displays. The un-boxing experience continues to grow and engage more and more consumers, garnering more hashtags and a growing number of shared YouTube experiences.
“The paper-based packaging industry faces the same headwinds that other packaging media do – an unsettled trade and tariff environment (although the just-signed USMCA will mitigate some of that uncertainty), and an election year,” said D’Angelo.
The Global Print Industry

The 6th drupa Global Trends Report, available now at www.drupa.com, shows that the global print industry is in stable condition overall:
- Global figures remain positive overall, with some regions and markets doing much better than others; and
- Political and economic concerns for the future dampen otherwise positive prospects for the majority.
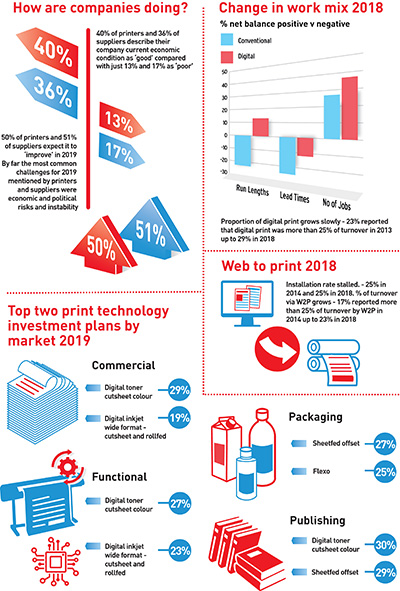
Globally 40 percent\of printers stated their company economic condition was “good” in 2018 compared to 13 percent who described their condition as “poor”, the rest rated it as “satisfactory”. This results in a positive net balance of 27 percent. For suppliers the positive net balance was 19 percent. Both groups remain optimistic, with 50 percent expecting better conditions in 2019.
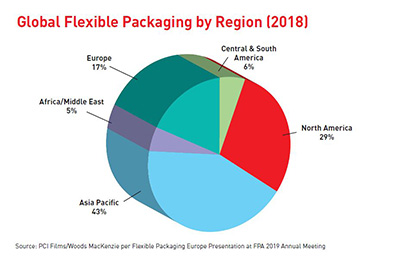
Conditions vary between regions and between markets. North America continued to enjoy strong growth in 2018, Europe and Australia had steady growth, while Asia, the Middle East and South and Central America were cautious and Africa was in decline. The 2018 results reflect the established pattern in most regions, although the decline in the Middle East and South and Central America seems to get worse.
The packaging market thrives as does functional, but there are clear signs of increasing caution in the commercial market and publishing remains subdued, with the encouraging exception of the books market.
These results are from the 6th annual survey conducted by Printfuture (UK) and Wissler & Partner (CH) in autumn 2018. Over 700 printers and 200 suppliers (senior managers who visited or exhibited at drupa 2016) participated, with all regions represented.
“The report shows that with a little more than a year to go until the start of drupa 2020, the global industry is in robust health overall,” said Sabine Geldermann, director of drupa at Messe Duesseldorf. “Clearly there are significant differences in prospects across different regions and markets as demand rapidly changes with economic conditions and evolving uses of print.”
Conventional print volumes continue to decline but slowly. In 2013, 23 percent of printers reported that digital print was more than 25 percent of turnover. In 2018, the proportion of printers had increased to 29 percent. Nevertheless, sheetfed offset remains the most common form of print technology, present in 66 percent of all printers. Sheetfed offset volume continues to grow in packaging but there was a clear decline among commercial printers for the first time.
Web to print volumes are increasing slowly. In 2014, 17 percent of participants with W2P installations reported more than 25 percent of turnover came from that source. By 2018, that proportion of participants had increased to 23 percent. Yet the proportion of printers with W2P installations is static – 25 percent in 2014 and 25 percent in 2018.
In terms of capital expenditure, 41 percent of printers spent more in 2018 than in 2017, while just 15 percent spent less and expenditure grew in all regions except Africa. Those in packaging and functional markets were very confident while those in commercial and publishing markets were more cautious. It was generally the same pattern among suppliers. For printers, finishing equipment was the most common target in 2019, followed by print technology and prepress/workflow/MIS. As for print technology, digital toner sheetfed color was the most common target for investment in 2019 for all markets, except for packaging where sheetfed offset took first place. Yet the packaging market saw a 5 percent growth in the proportion of SKU’s specifying digital print across all applications, except for labels where the figure is already 40 percent.
U.S. Nonwovens Industry Strong and Growing
Dave Rousse, president of INDA, the Association of the Nonwoven Fabrics Industry in North America reported to PFFC that:
The nonwovens industry is global, high-tech, high growth and produces engineered products that make lives better, safer and healthier. In North America, the nonwovens industry is doing very well with high levels of production, continued new investments in plants and equipment and greater interest in the sector from the financial community and from nearby industry sectors like paper and paper machinery/equipment.
The strong and improving drivers of the U.S. economy are supporting increased demand for nonwoven products in almost every sector. Since nonwovens can be engineered to meet specific performance attributes for a specific end use, the gaining of share from other materials in existing end uses, and the ability to enter entirely new end uses will continue to be catalysts for nonwovens growth.
The nonwoven industry thrives on innovation to meet ever-evolving needs, and there are many factors that play a role in attracting new investment to support innovation. The availability of low cost and reliable sources of energy are important operating factors for nonwovens production and investment. The availability of low cost capital and confidence in the legal protection of intellectual property, are also strengths.
The high level of innovation in nonwovens is primarily because:
- The technology platforms are so versatile, and
- There are always new needs to be met.
The versatility starts with the wide variety of fibers and resins available, with many still being developed. Then there are a variety of web forming processes to establish the fibrous assembly. The fibers of this assembly need to be bonded, and there are several processes to do this, each delivering their own distinct properties and attributes, such as softness, loft, strength, porosity and a number of other properties that can be engineered and controlled. Finally, there are a growing number of processes to add functionality to the nonwoven through surface treatments or mechanical adjustments. The tailoring of a nonwoven material to meet the specific needs of a particular use is a key strength of this platform. Moreover, there are an infinite number of new needs that continuously emerge for which a nonwoven solution can be engineered.
We are seeing strong nonwoven demand in several sectors in North America. In the last few years, the transportation sector (cars, trucks, buses, planes, etc.) has had the highest level of growth as lightweight, high strength nonwoven materials are displacing other materials in the constant quest for more energy efficient, quiet and comfortable vehicles. Nonwoven materials are displacing blown plastic and metals in the areas of automobile acoustic control, thermal control, vibration control, voltage control (battery separators) and structural support. In the last three years, 21 new nonwoven lines have been added in North America that intend to provide material to the transportation sector.
Filtration media has also been strong as public awareness of health issues drives demand for cleaner air, water, food and household goods. Recently, there have been several studies published from highly credible universities and institutions that quantify and correlate Indoor Air Quality (IAQ) with wellness, workplace productivity and employer health costs. This, plus increasing consumer awareness and concern about purity of water and food, have driven nonwoven filter media sales up about 5 percent per year for the last several years with continued growth at or above that level through 2021.
Disposable wipes also continue to grow due to the American consumers’ continuous pursuit of (and ability to afford) convenience items. Disposable products like wipes and disposable incontinence products require a relatively high level of disposable income before countries adopt these products. The first nonwovens to be adopted are wound care products, followed by feminine hygiene products and then baby care as per capita disposable income rises, so wipes and incontinence products are strong sellers in the U.S. with lower market penetration (and greater opportunities) in other countries.
The largest sector for nonwoven usage, absorbent hygiene, sees slower growth but a lot of innovation as end-product makers seek competitive advantage, and as the fast-growing incontinence segment, driven by aging Baby Boomers, offsets the slower growing Baby Diaper segment. We see units of baby diapers having some growth, but due to “light weighting” of modern product designs, the move to thinner diapers and fewer diaper changes due to improved diaper performance, the tons of nonwoven material going to this area is slightly down. Incontinence products, however, are looking at 8 percent growth over the next few years as the stigma of incontinence has been reduced and the consumer desire for an active, full life in middle and senior age groups is very strong.
Nonwoven materials are engineered materials that provide solutions to real needs, and the needs are ever evolving. This is a healthy situation for companies that have their heads up and looking for new opportunities. Introducing improved haptics to incontinence products will expand the growth of that sector. Increased knowledge of the health benefits of clean indoor air will provide opportunities for the filtration sector, along with sensors/monitors to track IAQ quality and signal for a filter change. And the transportation sector will continue to utilize the high strength to weight ratio of nonwovens to replace blown plastics and compressed materials in vehicles.
Overall, the North American nonwovens industry is experiencing a robust period with strong prospects for continuation. As long as there are evolving market needs driving innovation, there will be a good market for nonwoven engineered materials to meet these needs.


