


Critical Trends: 2009 PFFC Survey
- Published: June 01, 2009, By By Yolanda Simonsis, Editor/Associate Publisher
The PFFC exclusive annual survey on Critical Trends impacting our industry was eye opening, at the very least. The data Penton Research has gathered since our first published Critical Trends survey in 2006 tells quite a revealing story over the course of time as the reader will learn for much of the tracked history. Reflected in the following pages are the results from many of the questions distributed in a survey conducted March 23-April 1.†
Download Critical Trends in PDF format
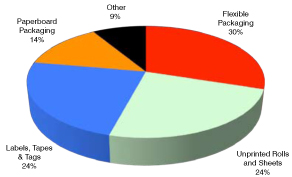
This survey is unlike any other in that PFFC is in the admirable position of being able to solicit meaningful responses across the full breadth of the entire converting industry without bias toward any one segment as most organizational surveys tend to lean. The cumulative results that follow are representative of responses across our industry for the following four converting sectors: flexible packaging; unprinted rolls and sheets; labels, tapes and tags; and paperboard packaging.
Electronic subscribers of our E-Clips e-newsletter can look forward to receiving a quarterly publication of results from this survey, broken out by sector and by question, for the sake of specific comparison. In this way, subscribers in each of these four segments can determine how their performance compares to other converters in their sector.
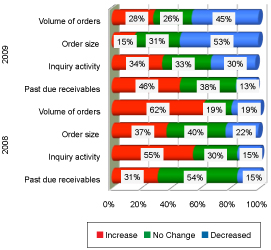
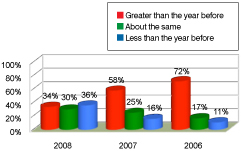
Expectations for Business Activities: 2009 vs. 2008
To become a subscriber to E-Clips, visit: http://subscribe.pffc-online.com/subscribe.cfm?tc=NNWEB.
Primary Business
†Survey sent to an effective mailing of 22,141 recipients. Qualified returned surveys from only converters (no suppliers or equipment manufacturers), numbered at 207.
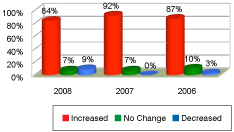
Change in Financial Indicators
Respondent expectations for 2009 reflect the harsh realities of the current economic crisis. More than half (53%) of all respondents expect order size to decrease in 2009; 45% expect volume of orders to decrease; and 30% expect to see less inquiry activity. And almost half (46%) expect to contend with an increase in past due receivables in 2009.
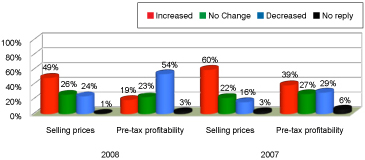
Change in Customers' Revenue & Profitability
Each primary business type was well represented this year in our converter sample. Just under a third of respondents (30%) are employed in the flexible packaging sector; 24% were in unprinted rolls and sheets; 24% in labels, tapes, and tags; and 14% in paperboard packaging. The companies for which the typical respondent works employ an estimated median of 75 employees.
Pre-tax profitability decreased in 2008 for more than half (54%) of respondent companies while less than a third (29%) reported decreased pre-tax profitability in 2007. There was less of a tendency in 2008 to increase selling prices (49% versus 60% in 2007).
The economic crisis has taken a dramatic toll on customers' revenue and profitability with more than half (55%) of all respondents reporting their customers' profitability decreasing along with 52% reporting a decrease in their customers' revenue. This downward trend is particularly remarkable, considering the increases enjoyed in 2006 in both revenue (58%) and profitability (41%).
Page 2 of 3
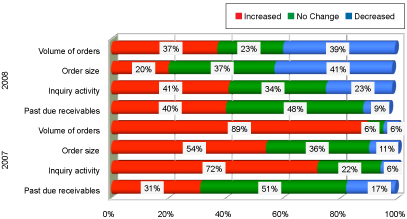
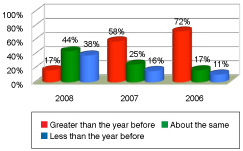
Business Activities: 2007 to 2008
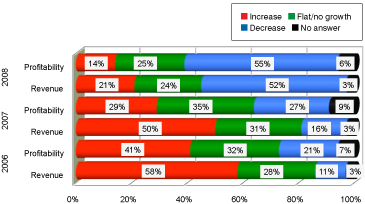
Decreases in volume of orders, order size, and inquiry activity were far more common in 2008 than 2007. Each of these business activities diminished significantly in 2008. The only activity that saw an increase over 2007 levels was past due receivables (40% in 2008; 31% in 2007).
Impact of Imports
Sales revenue and profit margin were negatively impacted for 40% and 39% of respondents' businesses, respectively. Revenue was down an average of 15%, with profits down an average of 10%.* Converted products negatively impacting businesses were most likely imported from China (89% in '09 vs. 76% in '08), followed by Mexico (down in '09 at 22% vs. 25% in '08), and India (up in '09 at 21%, just a fraction better than in '08). Almost a fourth of respondents (24%) have partnered with a company outside the US to produce converted products. Another 7% have active plans to do so.
Most Profitable Investments/R&D
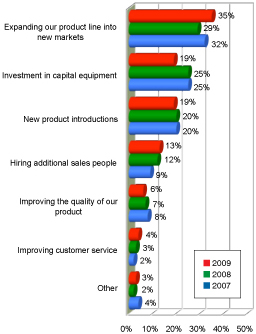
Expanding a company's product line into new markets for 35% of respondents was considered the best investment of resources. Capital equipment and new product introductions also were considered wise investments (19%).
A new question we added for this year's survey concerned research and development to determine the trend on funding this necessary part of business “used to develop new technologies and/or products that lead to new sales with higher margins,” as Dr. Richard Podhajny wrote in his last column before his death in the August 2005 issue on p28 of PFFC. Responses indicated that 19% had increased investment in R&D and 68% reported no change. But 10% had decreased investment with 3% providing no answer. We will continue to track this information in coming years.
Change in Revenue: 2007 to 2008
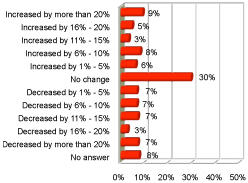
More than one in three respondents reported decreased revenue in 2008; however, the typical respondent company's revenue increased an average 3.1%.
Page 3 of 3
Sustainability Efforts & Sales
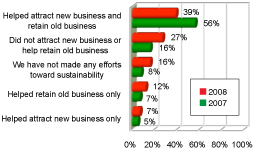
Converters that focused efforts on sustainability continued to experience positive impact on sales in 2008, even in the midst of our recent economic crisis — although the impact was somewhat less dramatic in 2008 compared to 2007. More than half (56%) of all respondents in the previous study reported that sustainability efforts helped them attract new business and retain old business in 2007, compared with 39% in 2008.
Sustainability efforts added costs for the majority of respondents. While 29% were able to pass on those costs to their customers, 47% were forced to absorb them. One in five (21%) reports sustainability efforts have reduced the costs of doing business.*
Impact of the Economic Crisis
Not surprisingly, the recent economic crisis has taken a toll on respondent businesses. The vast majority (84%) report the crisis has negatively impacted their businesses while 6% have felt no impact. A combined 10% have experienced slight to substantial positive impact.* One area of negative impact concerns staffing levels. More than third (38%) reported staff reductions in 2008, with overall employment decreasing by an average 2.7%.
Materials Costs
Trends in 2008 materials costs reflected those of previous years. As in the past two years, the vast majority of respondents were faced with more expensive materials in 2008. Materials costs increased an average 8.8%.*
Plant Capacity Utilization & Business Backlog

Plant capacity utilization was somewhat lower in 2008 at a mean average of 70% compared to 79% in 2007, and 73% in 2006.* Business backlog decreased for 62% of respondents in the last half of 2008.
New/Expanded Service Offerings

Three-fourths of respondents plan to add or expand products/services. Printing capabilities were reported by 35% as the most popular response, followed by 30% for laminating and/or coating capabilities (29%).
Custom Research
Penton Media can customize a research study just for you. Our team of highly accredited experts is experienced in specific industry sector research. Our expertise is backed by a proprietary database of more than 3 million business-to-business names. For more information visit www.penton.com or contact Elinor Rice, senior research manager, at elinor.rice@penton.com.